Energy balance
On the Energy balance page, you can monitor the energy balance of your properties as well as the ratio between purchased and produced energy. The information is presented both graphically and as a table under the graph.

Information selected for the report
Selecting the building
Select the building from the drop-down menu in the top right corner.

Selecting the year
Select the year below the selected building. The current year is used for the report by default.

Contents of the report
Energy balance
The Energy balance indicator shows the amounts of sold and purchased energy as well as the difference between them.

Total energy consumption
The Total energy consumption graph shows how the total consumption is divided by type of energy.

Purchased heat and heat production
The Purchased heat and heat production graph shows the division between purchased and produced heat.

Purchased electricity and electricity production
The Purchased electricity and electricity production graph shows the ratio between purchased and produced electricity.

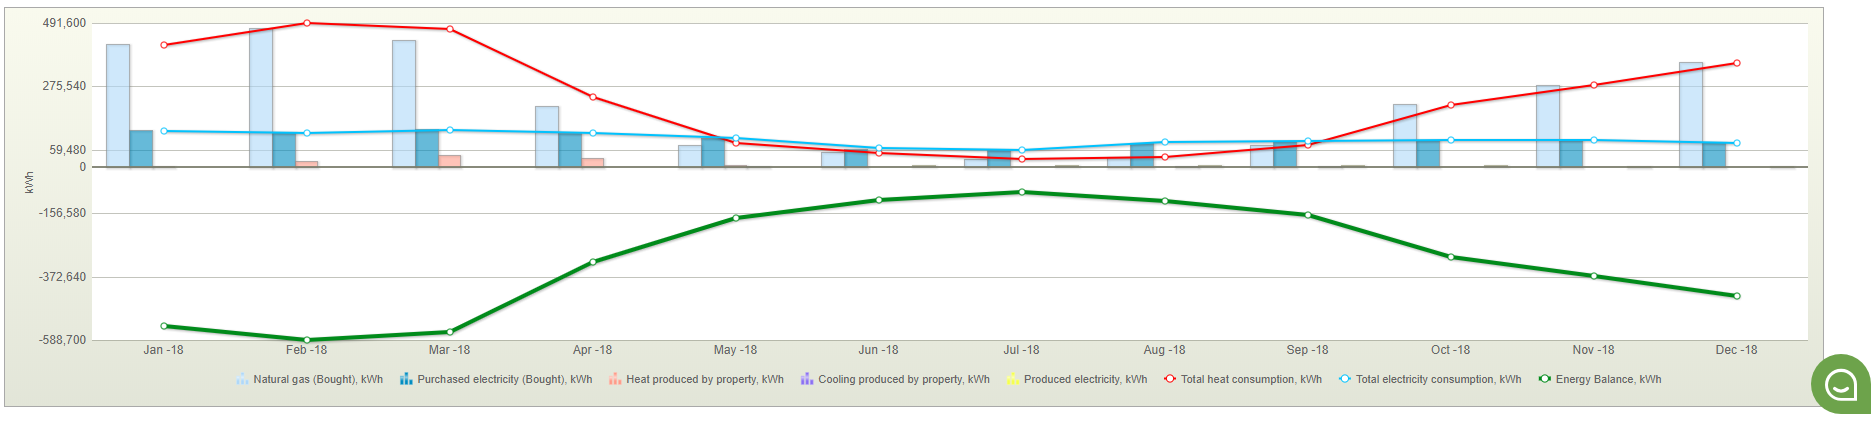
Energy balance graph
The graph shows the energy balance, the total electricity consumption, the total heat consumption, as well as the amounts of purchased and produced energy.
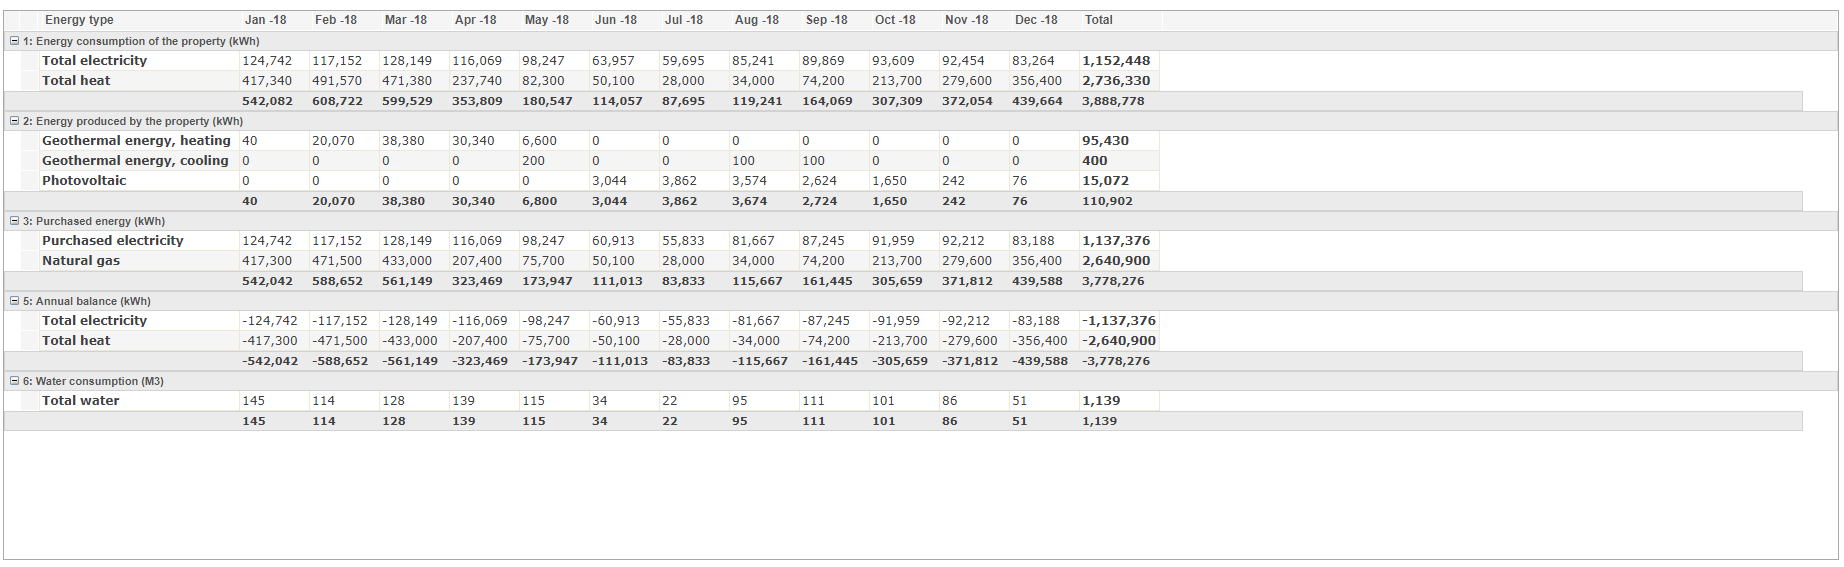
Table
The values of the graph are shown as a table below the graph. In the table, you can see the exact values by type of energy with the accuracy of one month, as well as the sums total.