Energy reports
Building's year comparison report
On the Building's year comparison report, you can see quickly how the energy consumption, CO2 emissions and the Indoor air quality and Indoor thermal conditions stability have developed during the year and compare them to the previous years.
The values of the selected year are compared with the values of the two previous years, and the results are presented with the accuracy of a month in both a graphic format and as a table. This makes it possible to see the overall situation at a glance.

Information selected for the report
Selecting the building
Select the building from the drop-down menu in the top right corner of the page.

The building structure of a building can be selected with the drop-down menus Portfolio > building > Building structure.

| Note | |
|
The energy report shows the consumption of the selected building or building structure, but the KPI values refer to the building, not the building structure. |
Selecting the year
Select the desired year from the Year drop-down menu.

The KPI values of the previous year can be seen in the top right corner of the report.

Normalized heat
Normalized heat consumption values can be shown on the report by selecting the Heat norm. check box.

Contents of the report
Energy consumption information
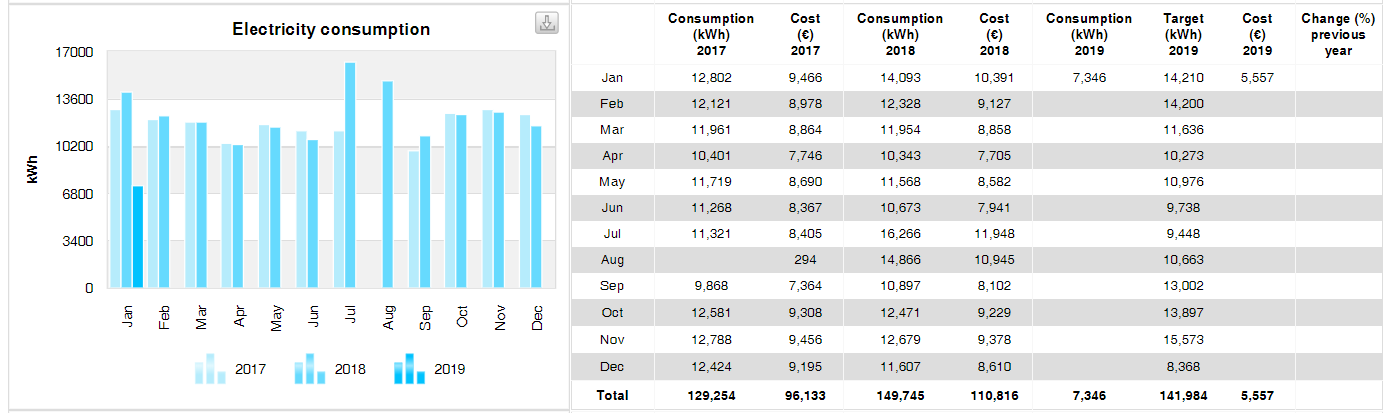
The consumption of heat, electricity, water and cooling is compared to the consumption of two previous years with the accuracy of a month. Each type of energy is presented separately in its own graph.
The consumption is shown both as a bar graph and as a table, which makes it possible to study the values in more detail. In addition, the table presents the costs, the target for the year being reviewed, and the change in the type of energy in question compared to the previous year.
Heat consumption

Electricity consumption
Water consumption

Cooling

CO2 emissions
The CO2 emissions are compared to the two previous years. The emissions of the selected year are shown as a whole in the table next to the graph as well as divided by types of energy. In addition, the targets are stated, and the change compared to the previous year is calculated.

Indoor air quality stability
The indoor air quality stability is compared to the two previous years.

Indoor thermal conditions stability
The indoor thermal conditions stability is compared to the two previous years.

Submeter report
In the Submeter report, the consumption readings of the submeters on the building or building structure can be studied. There may be several submeters, and you can compare the consumption between different months and submeters.
You can select the desired information to be shown in the submeter report in accordance with the section Information selected for the report, after which you can update the information on the page by clicking the Show button.
Information selected for the report
Selecting the building
Select the desired building from the drop-down menu in the top right corner of the page.

Selecting the year
Select the desired year from the Year drop-down menu.

Selecting the energy type
The energy type selection buttons can be used to select the specific type of energy, the submeter readings of which you want to view. Selecting All means that the data points are not limited by energy type.

Selecting the building structure
By selecting the building structure you can limit the number of submeter readings available.

Selecting the data points
Select the data points you want to review from the Data points drop-down menu.

| Note | |
|
Several data points can be selected for the report. |
Other information on the report
Timestamps, exact values and costs can also be shown on the report by selecting the relevant check box.

Viewing submeter readings
After the desired information has been selected, the monthly consumption values of the submeter readings as well as the other information selected above are updated in the table. The table can be used to compare submeter readings as well as monthly values.

| Note | |
|
There is a search field on the top of the table that can be used to search the submeter readings based on a search word. |
Downloading the report as an Excel file
The submeter readings can be downloaded as a separate Excel file by clicking the Export to file (xlsx) button in the top right corner of the table.
 button")