Energy trends
The Trends page is a useful tool for determining the consumption profile of the building.
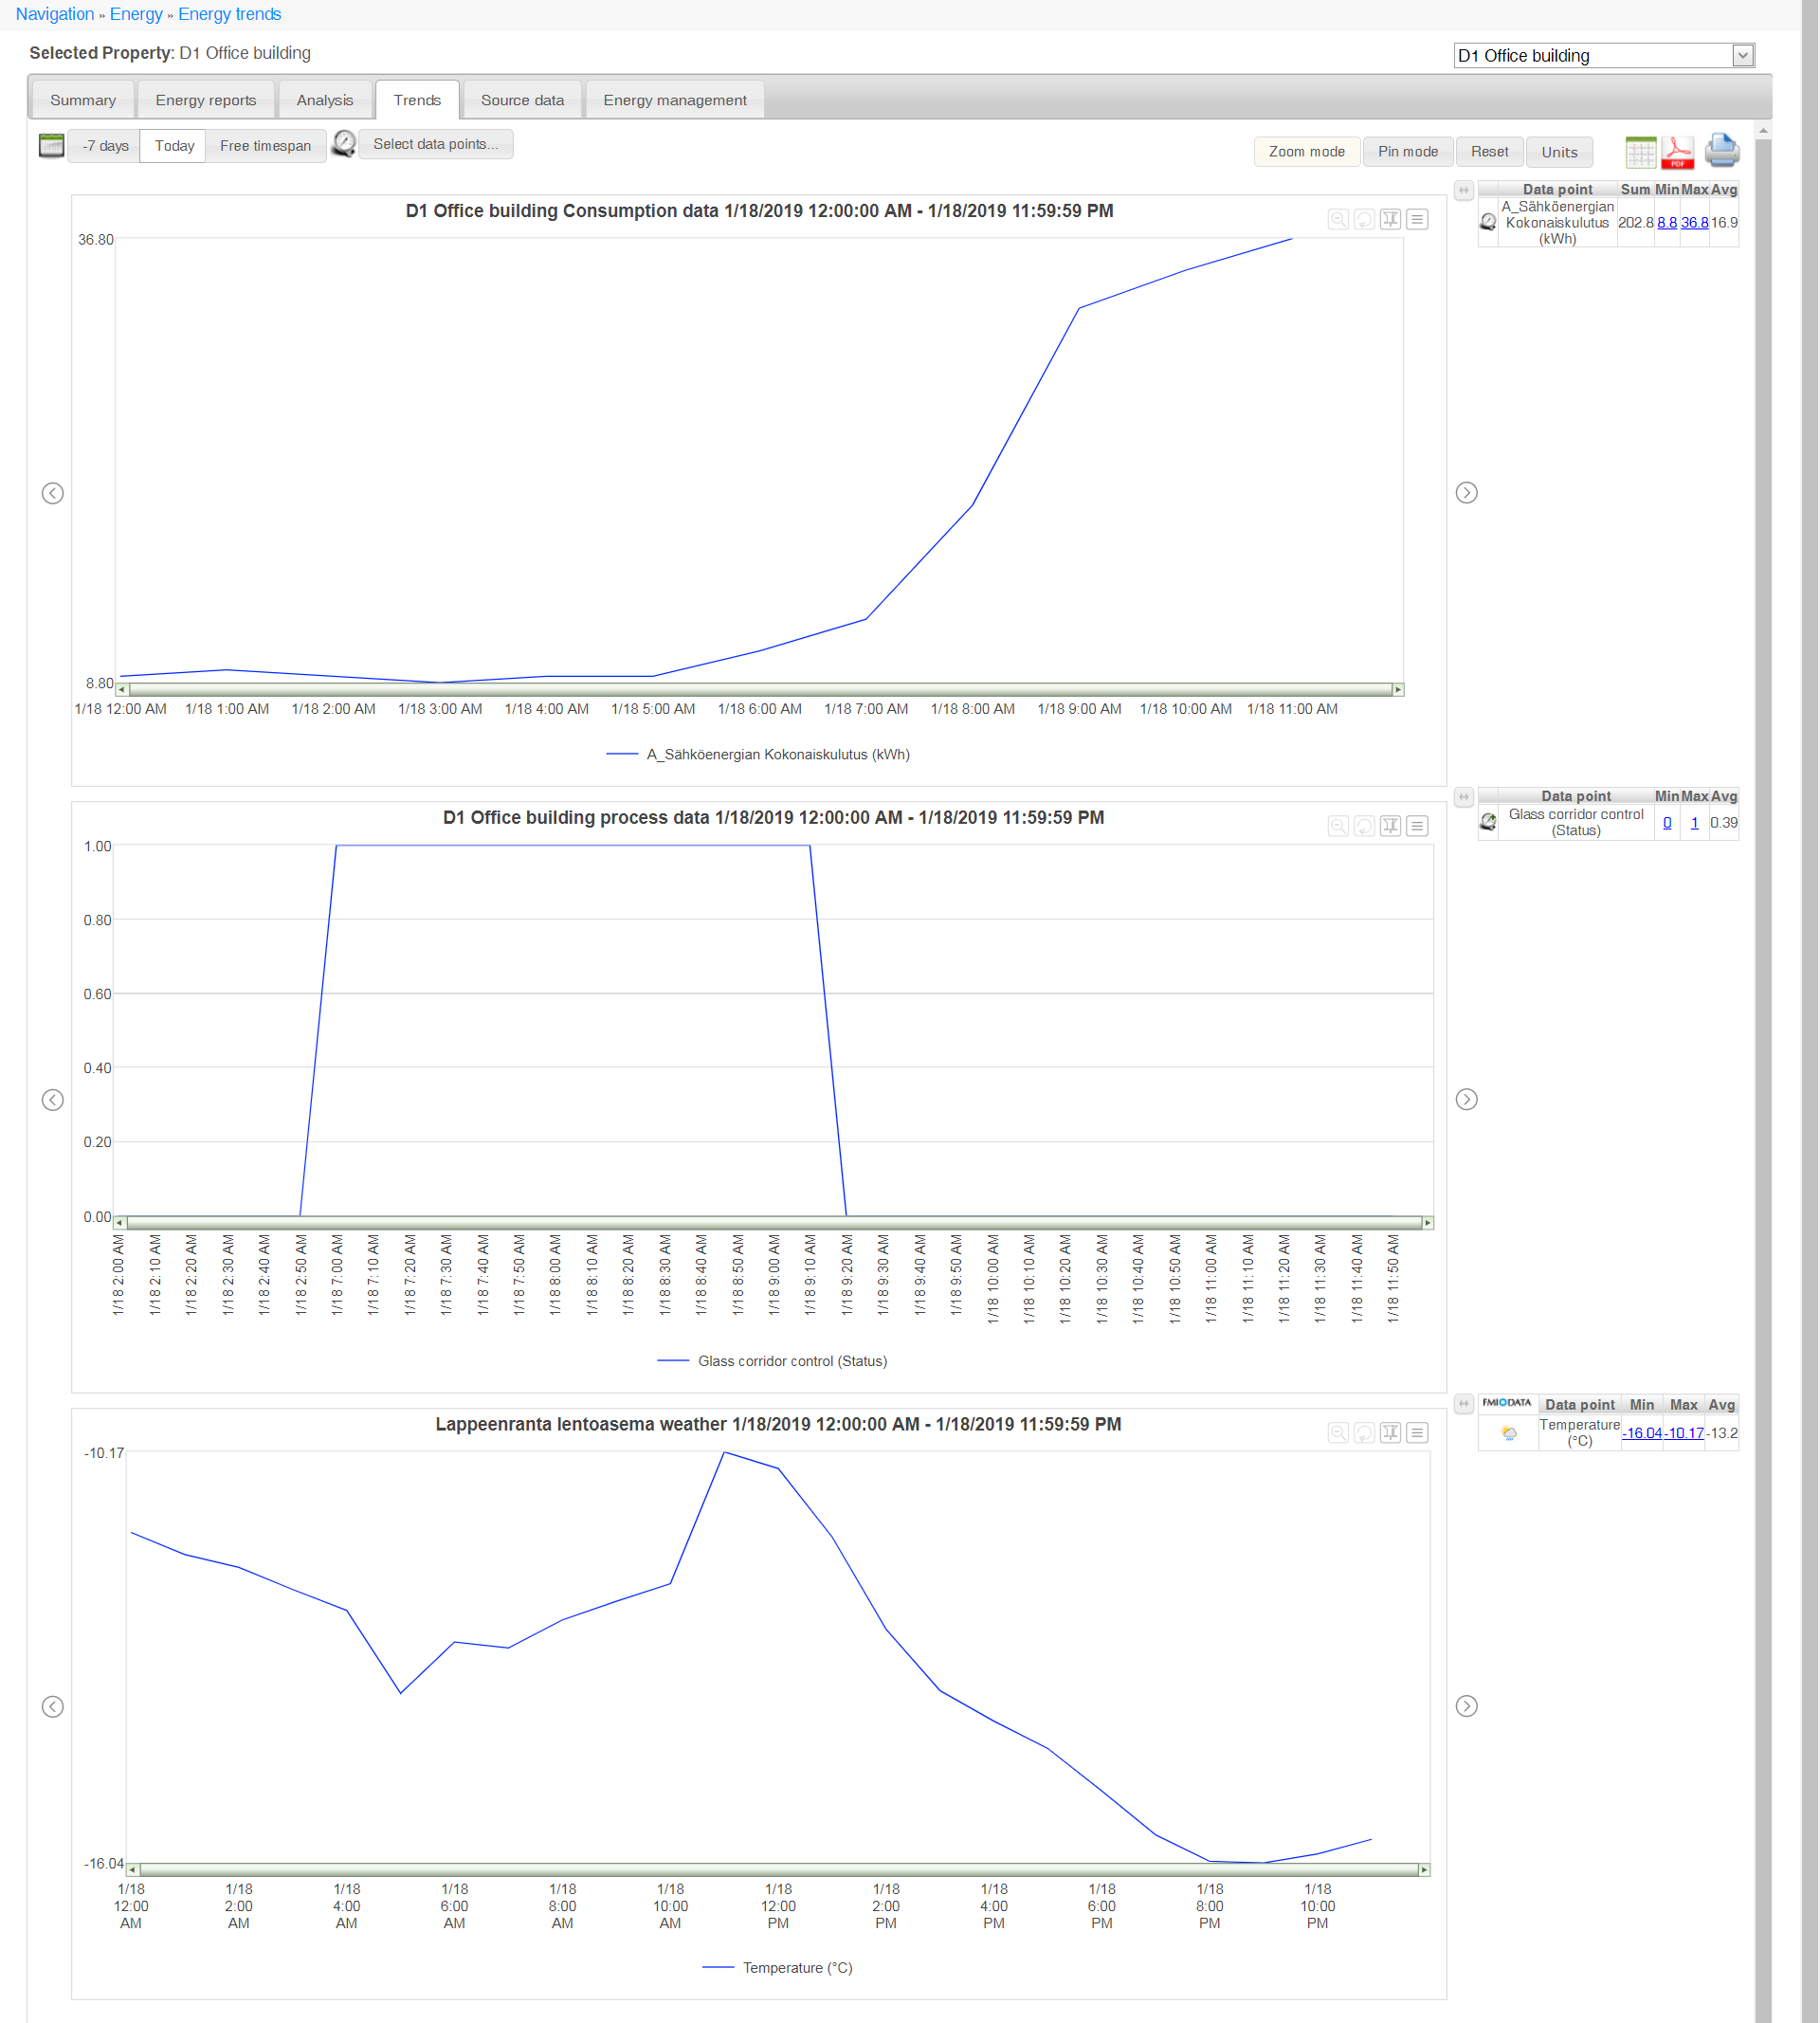
On the Trends page, the trends of the building’s consumption and process data as well as weather can be reviewed with the accuracy of an hour. You can select more than one data point, meaning that you can compare the trends with each other.
Selecting information
Selecting the timespan
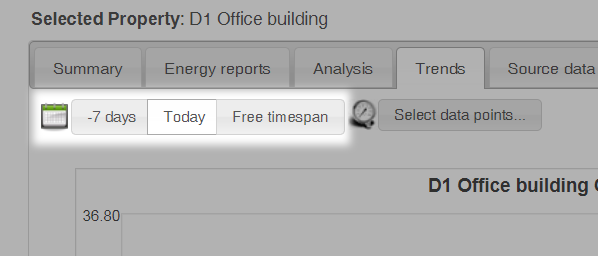
Select the timespan for following the trends by using the selections at the top of the page.
-7 days
If you select -7 days as the timespan, the trends of the past week are shown.
Today
If you select Today as the timespan, the trends of the current day are shown.
Free timespan
Free timespan allows you to enter the timespan manually. The maximum length of the free timespan is 12 months.
Selecting the data points
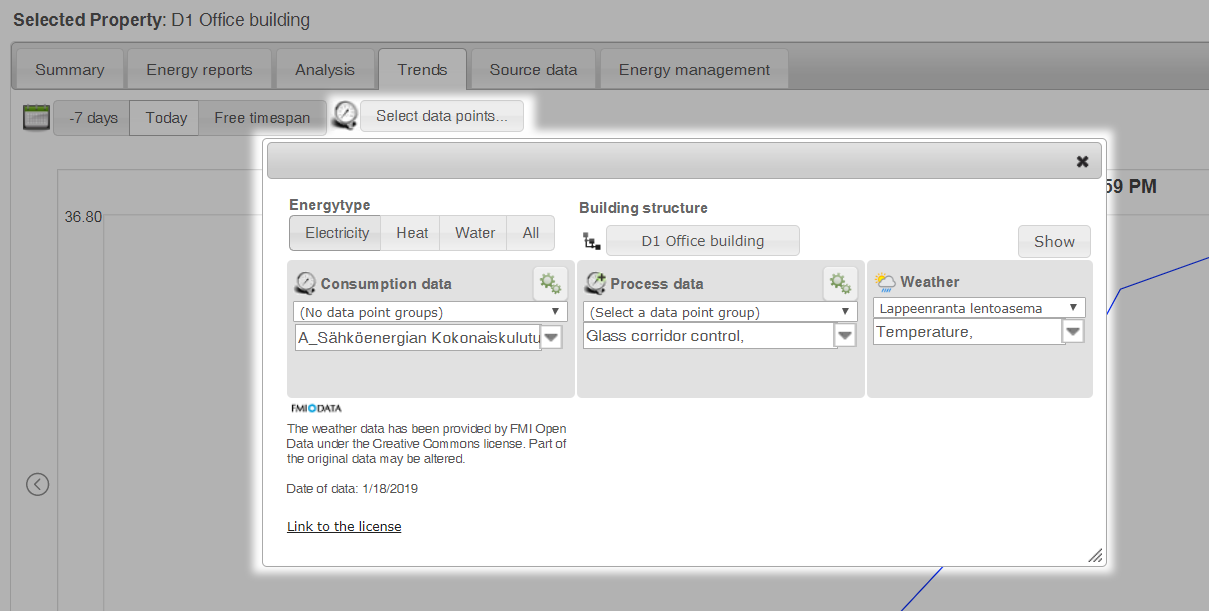
Select the data points in the data point selection window. You can display the window by clicking the Select data points... button.
Filtering data points
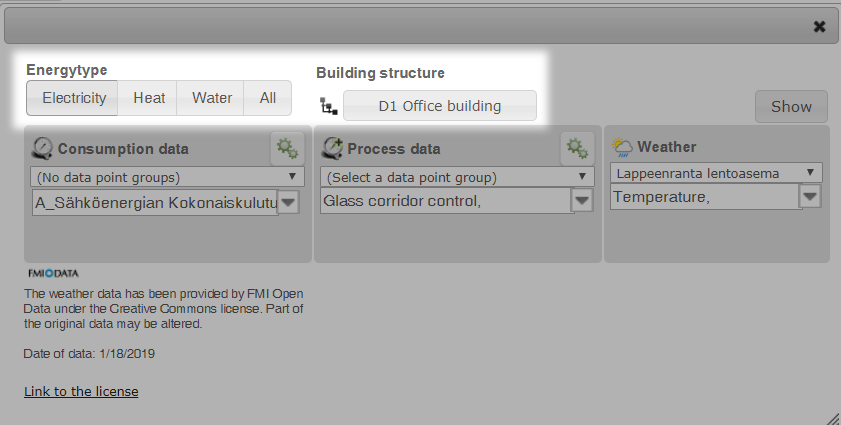
Data points can be entered with the selections at the top of the page based on the type of energy and the building structure.
Selecting a data point group
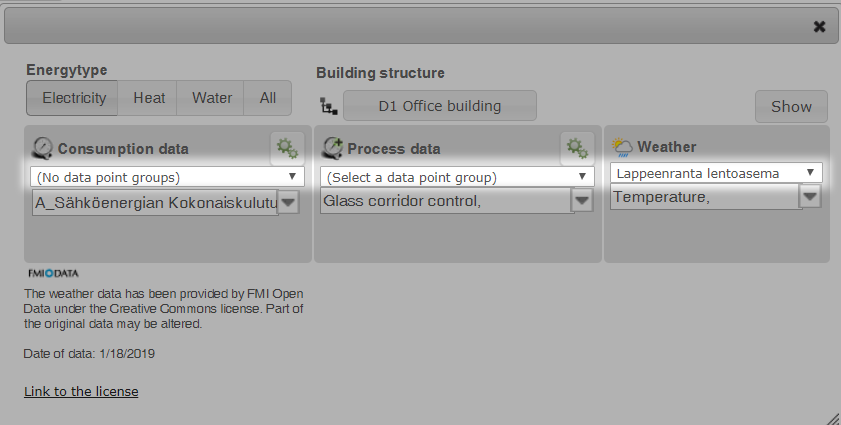
Data points can be grouped into data point groups, and you can choose the desired group from the Select a data point group drop-down menu above each data point’s drop-down menu.
| Note | |
|
If data points have not been grouped, the selection shown in the Select a data point group drop-down menu is (No data point groups). |
Selecting the data points for the trend report
Select the desired data types for the trend report from each data type’s drop-down menu. The data types in the trend report are as follows:
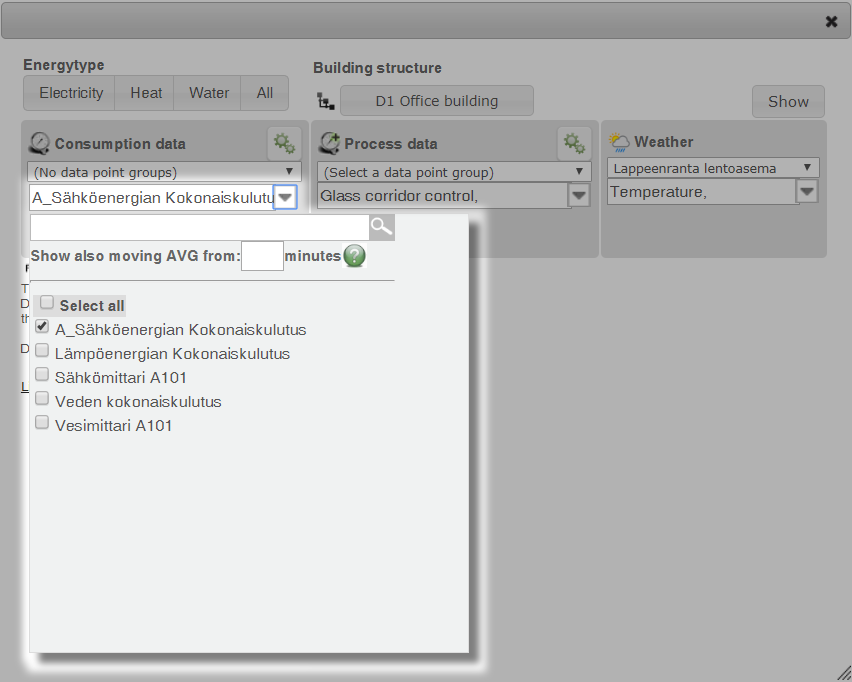
When the data points have been selected, you can update them on the page by clicking the Show button.
| Note | |
|
A maximum of 15 data points can be selected for the graphs. |
Viewing the results on the browser
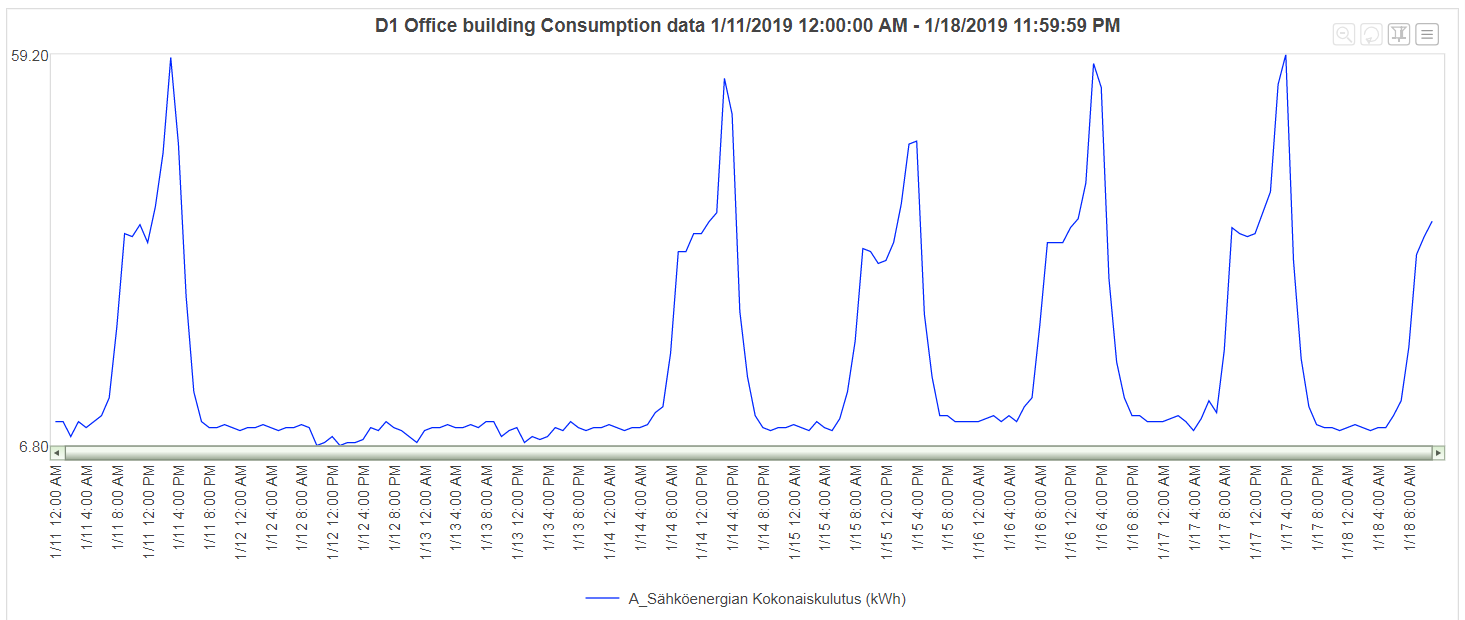
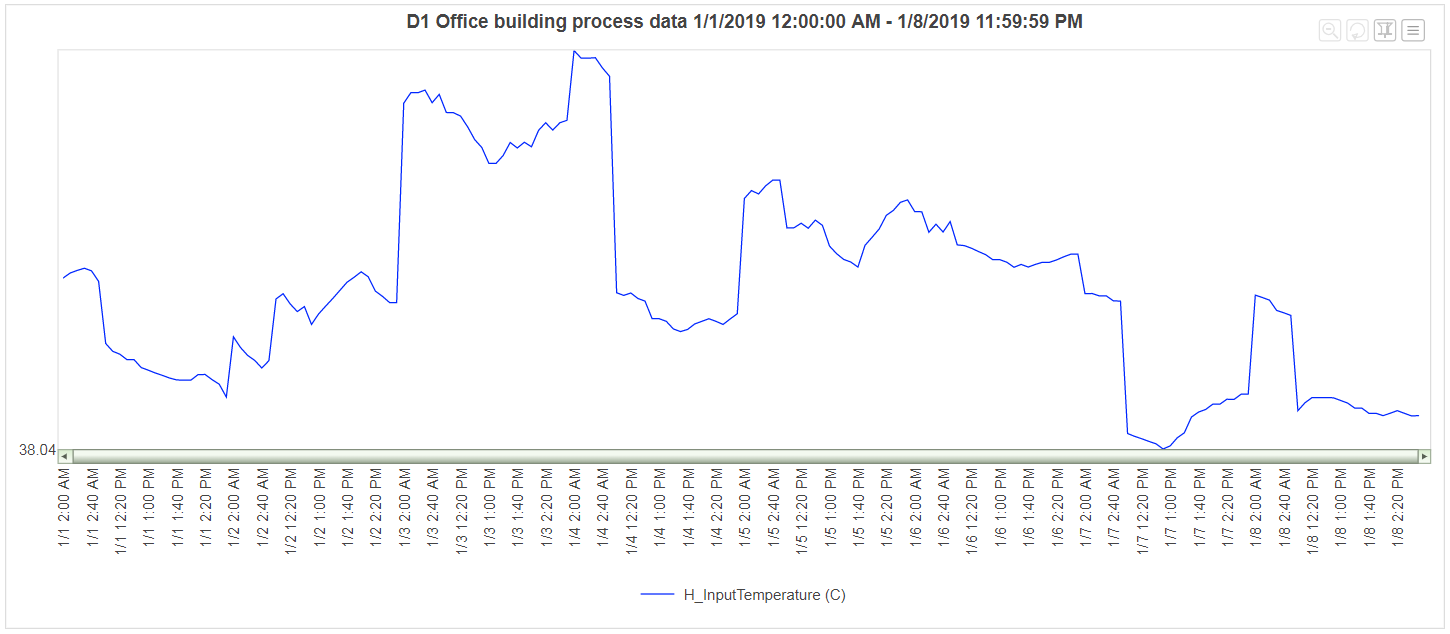
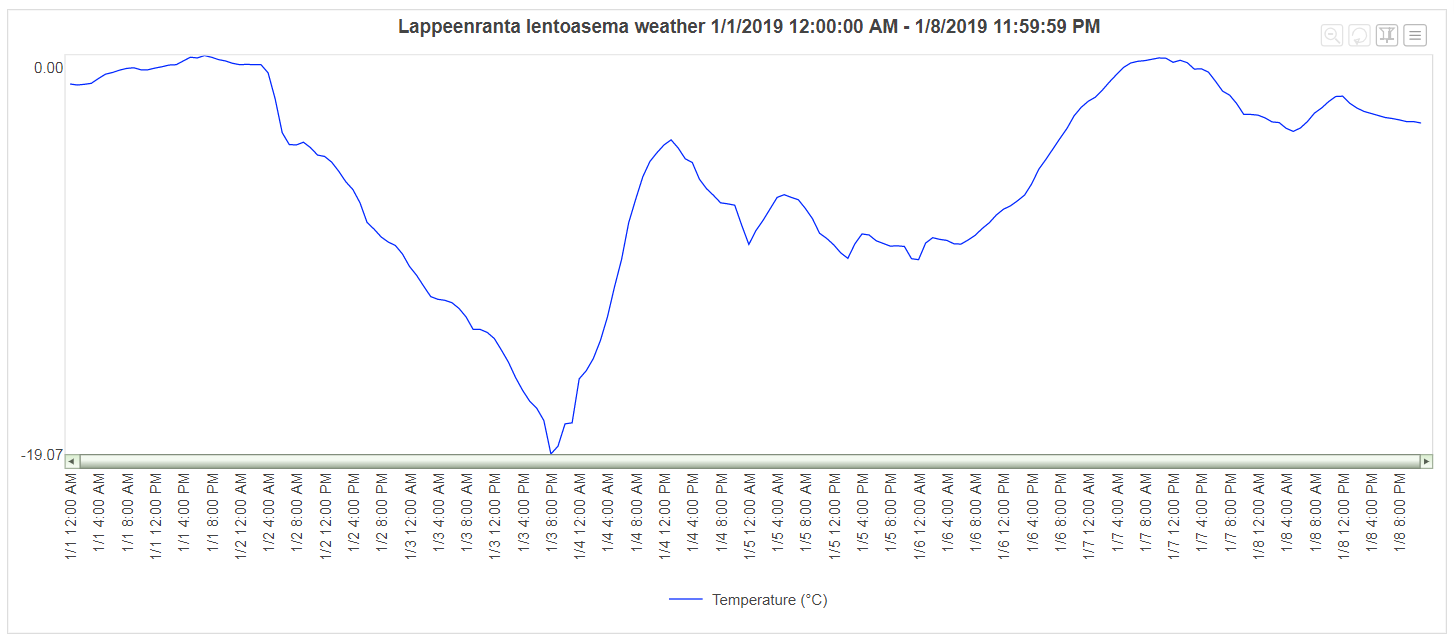
The values of the selected data points during the selected timespan are shown in the graphs by data type. Next to each graph there is a table showing information related to the data points, such as the sum (only for the consumption data points), the minimum value and the average.
Consumption data
Process data
Weather
Additional selections for graphs
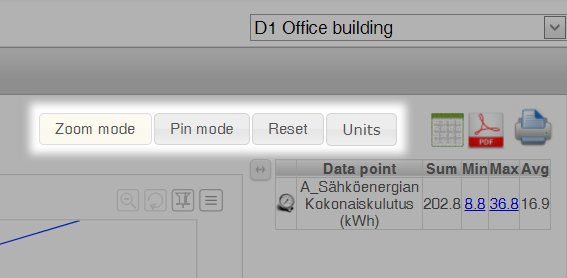
Zoom mode
In the zoom mode, a timespan on the graph can be selected with the mouse; after selection, the timespan is updated and displayed on the whole width of the graph. This allows a more detailed review of the measured values during the desired timespan.
Pin mode
In the pin mode, a timespan on the graph can be selected with the mouse; after selection, the selected values can be dragged to another section of the graph. This makes it possible to place values from different timespans on top of each other for comparison.
Reset
By clicking the Reset button, the selections made in the zoom and pin mode can be removed and the page updated back to its original status.
Units
Clicking the Units button opens a window, in which the units used on the graphs can be selected.
Viewing the results in different file formats
Viewing the results as a grid
The graphs of the selected data points during the selected timespan can be shown in a grid on a separate tab by clicking the Show data in grid button ( ).
).
Downloading the results as a PDF file
The graphs of the selected data points during the selected timespan can be downloaded as a separate PDF file by clicking the Download PDF-file button ( ).
).
Printing out the results
The graphs of the selected data points during the selected timespan can be printed out by clicking the Print page button ( ).
).