Indoor conditions - Data
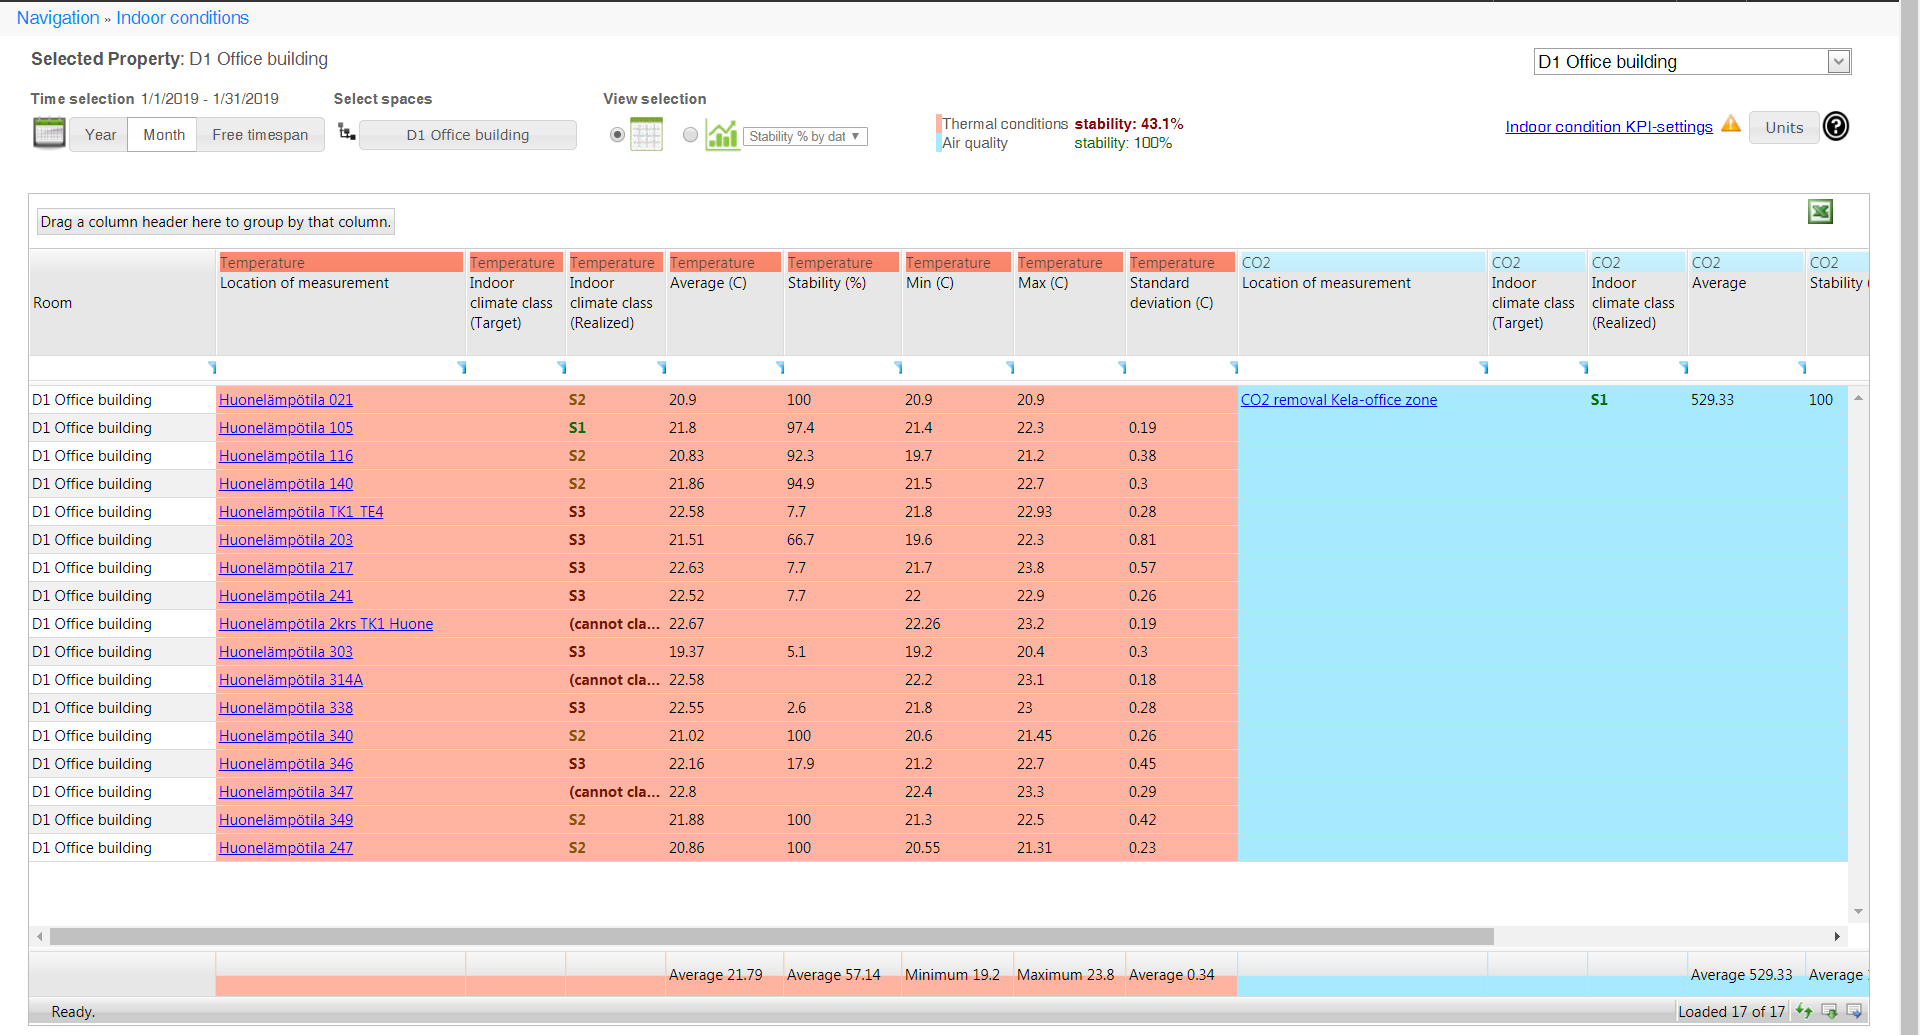
On the page Indoor conditions - Data, you can view the development of the indoor conditions of a building, building section or individual data point.

Indoor climate classification
The indoor climate classes are S1, S2 and S3.
S1 is the best and S3 the poorest. The indoor conditions classification and stability calculations comply with the RT07-10946 standard. The standard is more specific than the static class limits, which are based on seasons. The standard also yields better results, especially in spring and autumn.
| Note | |
|
Further information: https://www.rakennustieto.fi/kortistot/rt/kortit/10946 For more information about indoor classes, please consult the Indoor classes section of this guide. |
Information selected for the report
Selecting the building
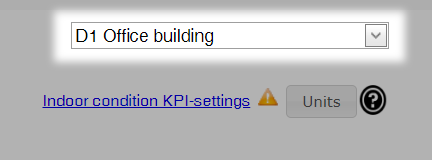
Select the building in the drop-down menu on the top right corner of the page.

Selecting the timespan
Select the timespan for which to view indoor data from the settings at the top of the page.

Year
With the Year selection you can select the timespan with a year's accuracy. The Current year shows the information of the current year and a several year long timespan can be selected with the Start year and End year options.
Month
With the Month selection you can select the timespan with a month's accuracy. The timespan can be selected with the Start month, Start year, End month and End year options.
Free timespan
With the Free timespan selection you can enter the timespan as dates in a calendar view.
| Huomio | |
| You can update the timespan to the page by pressing the Show button on the pop up window. |
Selecting spaces
The Select spaces opens a pop-up window where you can group and limit the information viewed.

Grouping:
- By meters shows the data of individual data points in a table.
- By space shows the data of the whole building section.
- By property shows the data for the whole building.
The selection of building section under the grouping allows you to limit the selection to only apply to a specific building section/space.
View selection
View selection makes it possible to view data in table format or graph format. You can select the KPIs to be displayed in graph view from the drop-down menu.

Stability of thermal conditions and air quality
KPIs of thermal conditions and air quality are displayed right of the view selection.

Indoor conditions KPI settings
The Indoor conditions KPI settings link takes you directly to indoor condition settings, where you can edit indoor conditions KPI settings.

Selecting units
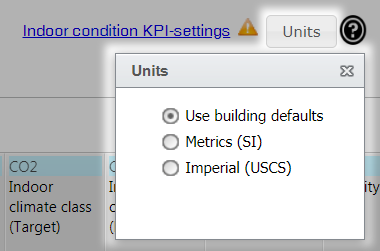
You can select the units used in the pop-up window that opens when you select the Units button.

Viewing report data
The desired indoor climate data is presented in either table or graph format, depending on the view selection. By adjusting the timespan, space or limits, you can view data all the way down to data point level.
Select a data point/building section in the table to delve deeper into the trend, which opens in a new tab.
Downloading the report in table format
You can download the report in xlsx format by selecting the Download Excel file button ( ) at the top right corner of the table.
Indoor climate classes
Temperature stability and classification based on outdoor temperature
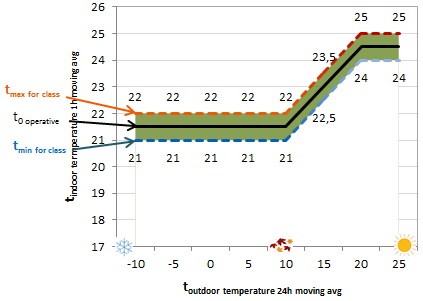
Indoor climate classification uses outdoor temperature data from the nearest weather station. Indoor climate classification is done in proportion to a sliding 24-hour average of outdoor temperature. Where outdoor temperatures measured at the weather station are not available, the outdoor temperature measured directly on the building can be used.
You can also set an operative (target) temperature for indoor temperature measurement. The default is 21.5 degrees, and this operative temperature can be changed in the settings. Calculation of indoor climate classification and stability is demonstrated in the figure below. The measured indoor temperature must be between the class minimum and maximum (green line) in order to belong in the class in question. Class limits change according to the outdoor temperature. The operative (target) temperature is at the middle of the green line.

Temperature default limits by class
Target temperature and permitted deviations at different temperatures (T = outdoor temperature)
| S1 | S2 | S3 | |||
|---|---|---|---|---|---|
| T ≤ 10 °C | 21.5 °C |
|
|
||
| 10 °C < T ≤ 20 °C |
|
21.5 °C + 0.3*(T-10 °C) | 21.5 °C + 0.4*(T-10 °C) | ||
| T > 20 °C | 24.5 °C |
|
25 °C | ||
| Permissible deviation from target | +-0.5 °C |
|
|
Default limits according to the season
Summer: 1 April–30 September
Winter: 1 October–3 March (FIN)
| Note | |
|
Static class limits for summer or winter are used in temperature condition classification ONLY when the outdoor temperature is not available. Under normal circumstances, dynamic class limits based on the outdoor temperature are used. |
| Indoor climate class | Type | Min summer | Max summer | Min winter | Max winter |
|---|---|---|---|---|---|
| S1 | Indoor temperature (°C) | 23 | 24 | 21 | 22 |
| S1 | Relative humidity (%) | 25 | 25 | ||
| S1 | CO2 (ppm) | 0 | 750 | 0 | 750 |
| S2 | Indoor temperature (°C) | 23 | 26 | 20 | 22 |
| S2 | Relative humidity (%) | ||||
| S2 | CO2 (ppm) | 0 | 900 | 0 | 900 |
| S3 | Indoor temperature (°C) | 22 | 27 | 20 | 23 |
| S3 | Relative humidity (%) | ||||
| S3 | CO2 (ppm) | 0 | 1,200 | 0 | 1,200 |
Class-specific stability limits
S1 Business and teaching spaces: 95% of utilization time. Residential spaces: 90% of utilization time.
S2 Business and teaching spaces: 90% of utilization time. Residential spaces: 80% of utilization time.
S3 No stability limits
| Note | |
|
Stability and classification Stability is calculated from the target class, if one has been set. If a target has not been set, stability is calculated from the realized class. Static class limits for summer or winter are used in temperature condition classification ONLY when the outdoor temperature is not available. |
| Note | |
|
Building types If the building type is office building, indoor climate classification is by default calculated on weekdays between 7 am and 5 pm. For other building types, indoor climate classification is calculated for every hour and every day. You can change these utilization times affecting classification in the settings. |
In this article
- Indoor conditions - Data
- Indoor climate classification
- Information selected for the report
- Selecting the building
- Selecting the timespan
- Selecting spaces
- View selection
- Stability of thermal conditions and air quality
- Indoor conditions KPI settings
- Selecting units
- Viewing report data
- Downloading the report in table format
- Indoor climate classes