Overview
The Overview shows at a glance what is going on with the buildings and whether targets are being met. On the pages, you can see whether the KPIs and targets of portfolios and buildings are being met as desired. There is a map view, which makes it easy to spot buildings where targets are not being met, for example.
The purpose of the overview is to provide information about buildings at a glance. You can adjust the page layout and contents based on what you need.

Selection of data
Selecting the building
Select the portfolio and building in the drop-down menus at the top of the page.

| Note | |
|
Select all lets you select all the buildings in the portfolio. |
Selecting the year

Select the year whose data you want to view in the drop-down menu at the top of the page.
Overview settings
You can edit overview settings in a pop-up window that opens at the gear symbol ( ).
).

Settings
Page style
Page style defines Portal style.
Select the style by selecting Dark style or Light style.

Unit system
Unit system defines the default system of units used in the Portal.
You can select the system of units used in a drop-down menu.

Overview template
Overview template defines the template on which the selected data is displayed. There are several template options, which are presented in section Overview templates in this guide.
You can select the overview template used in a drop-down menu.

KPIs shown in the overview
You can select four important KPIs with values you want to view for the overview. If you have selected a template with map view, the selected KPIs will show in the map view.
You can select the KPIs in the drop-down menus.

| Note | |
| KPI1 shows in the map view by default. |
Saving the settings
Remember to save the changes to overview settings by selecting the Save button. The Portal remembers the changes made, so the next time you use the overview, your saved settings will be used.

Overview templates
Yearly KPIs with map
The Yearly KPIs with map template allows you to view the four KPIs selected on a yearly basis.

Each KPI is shown as a separate indicator at the top of the page. The KPI displayed by each indicator is for all of the buildings selected.
The table under the indicators shows building-specific KPIs for each building selected.
The map view shows the status of the buildings selected in terms of the KPI selected. Use of the map view is described in section Map in this guide.
Yearly KPIs without map
The Yearly KPIs without map template allows you to view the four KPIs selected on a yearly basis.

Each KPI is shown as a separate indicator at the top of the page. The KPI displayed by each indicator is for all of the buildings selected.
The table under the indicators shows building-specific KPIs for each building selected.
Monthly KPIs
The Monthly KPIs template allows you to view the four KPIs selected on a monthly basis.

Each KPI is shown as a separate indicator at the top of the page. The KPI displayed by each indicator is for all of the buildings selected.
The KPI-specific graphs under the indicators make it possible to compare the KPIs with the targets set.
Yearly KPIs on big map
With the Yearly KPIs on big map template, you can specify the buildings shown on the map in regard to yearly KPIs.
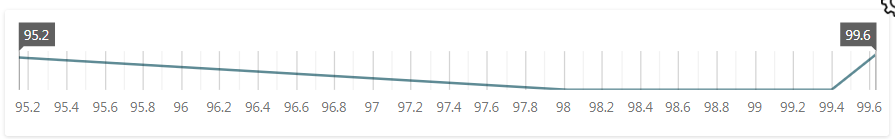
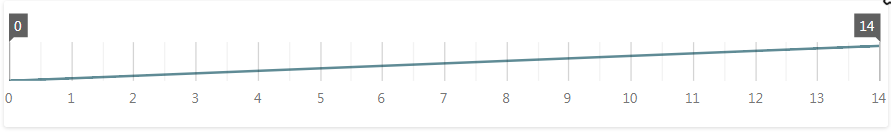
You can use the selectors at the top of the page to specify a minimum and maximum value for one or more KPIs, and the buildings within that range are shown on the map.

| Note | |
| You can change the selector’s minimum and maximum value by dragging the selector to the desired value. |
Use of the map component is described in section Map in this guide.

Yearly metrics on big map
With the Yearly metrics on big map template, you can view the desired metric on a yearly basis in map view.
You can select one or more buildings to show on the map. Select the buildings in the Building drop-down menu.

You can limit the metrics available for selection by selecting the desired category in the Category drop-down menu.

Select the metric to be viewed in the Metrics drop-down menu.

You can use the selector at the top of the page to specify a minimum and maximum value for the metric selected, and the buildings within that range are shown on the map. You can change the selector’s minimum and maximum value by dragging the selector to the desired value.
Yearly alarm metrics on big map
With the Yearly alarm metrics on big map template, you can view the desired metric in the alarm category on a yearly basis in map view.

You can select one or more buildings to show on the map. Select the buildings in the Building drop-down menu.
Select Alarms as the report category.

Select the alarm to be viewed in the Metrics drop-down menu.

You can use the selector at the top of the page to specify a minimum and maximum value for the metric selected, and the buildings within that range are shown on the map. You can change the selector’s minimum and maximum value by dragging the selector to the desired value.
Map
You can see on the map how the buildings are doing in terms of the KPIs and metrics selected. The Portal uses Google Maps, which includes functions for selecting different views and zooming the map.

The buildings selected for the report show on the map marked with different icons depending on their status in regard to the KPI or metric selected. Click on an icon to see the specific value.
Icon key
| Icon | Meaning |
|---|---|
 |
On target |
 |
Target exceeded |
 |
Data not available |
You can select the KPI you want to view from the bottom left corner. The default KPI is KPI1 as specified in settings. You can change the four options shown on the map by changing the page settings.

In templates on metrics, the bottom left corner shows the metric selected instead of KPIs.