Portfolio analysis
On the Portfolio analysis page, you can monitor how the portfolio targets are met and see in which properties meet the targets best and which have room for improvement. The distribution of the properties in the portfolio can also be studied based on the different KPI.

The page is divided into two parts.
Selecting information
Selecting the building
Select the desired portfolio and building from the drop-down menus at the top of the page.

Selecting the year
The portfolio analysis is presented by year. Select the desired year from the Year drop-down menu.

Downloading a report
The Portfolio analysis report for the selected year and building can be downloaded as a PDF file by clicking the Download PDF-file button ( ) in the top right corner of the page.
Deviations from targets
The Deviations from targets graph shows the KPI data of the selected properties compared to the target.

Limiting the number of properties to be shown
Limit the number of properties to be viewed by selecting the desired number of properties from the Show drop-down menu. This places the KPI information on the buildings on the graph in order from worst to best.
Selecting the target KPI
Select the consumption KPI, the realization of which you want to monitor from the Target drop-down menu.

Viewing the graph
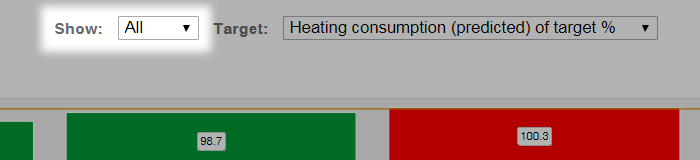
The deviation of the properties compared to the selected target is presented as a bar graph. The graph shows how much the different properties differ from the target and which properties meet the targets best.
| Note | |
|
The target is always 100% and the realized values are compared to it. |
The properties are drawn in the graph in the order from worst to best, so that the building that reached the target best is on the right. The green and red color indicate whether the target was reached or whether the target was exceeded.
Distribution of properties for the selected KPI
The graph Distribution of properties for the selected KPI shows the number of properties within the KPI limit values.

Selecting the precision
Select the precision you want to use to review the properties.

| Note | |
|
The precision specifies the number of points on the X-axis. |
Selecting the KPI
From the KPI to compare drop-down menu, select the KPI you want to study concerning the properties.

Selecting the real building type
Select the type of building to be reviewed from the Real building type drop-down menu.

Viewing the graph
The distribution of properties in relation to the KPI selected is presented as a bar graph. The graph shows the number of properties found in a certain interval and the portfolio average for the selected KPI.
The exact KPI values by building are shown in the table below the graph.
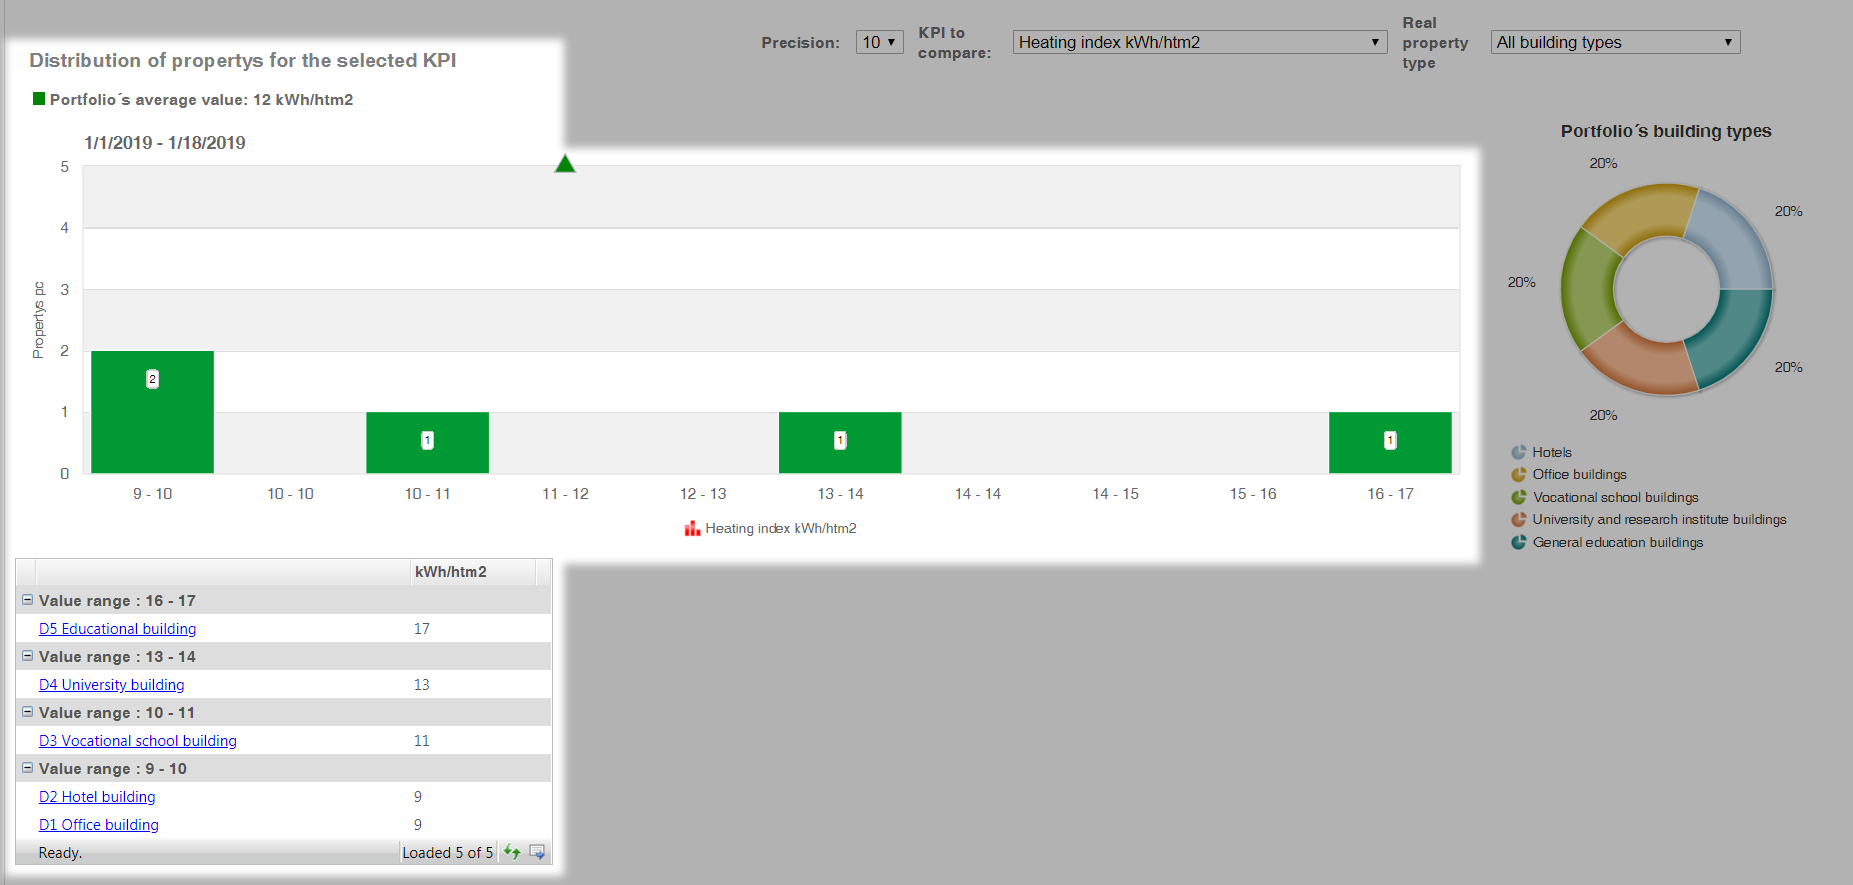
The portfolio’s distribution of properties shows the number of building types. You can highlight a specific building type by clicking its name.
