Portfolio source data
In the Portfolio source data page, the building data has been collected by portfolio. On the page, it is easy to see if data on a certain building is missing.
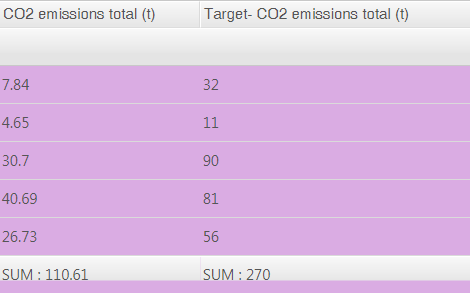
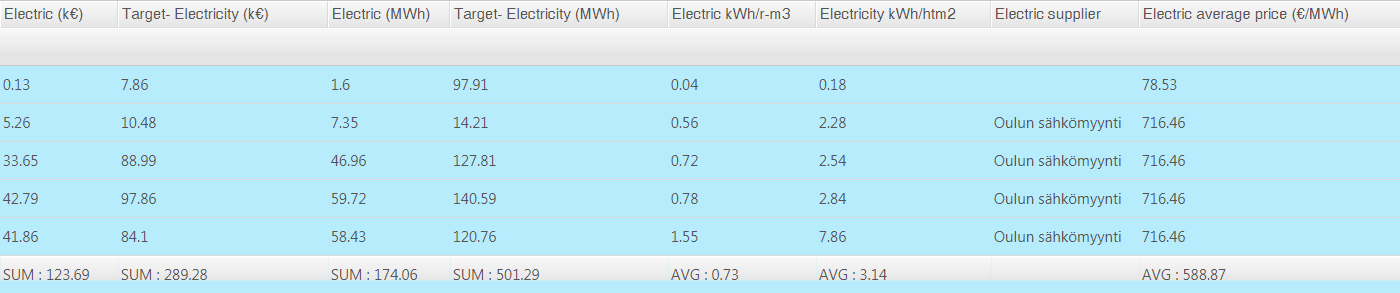
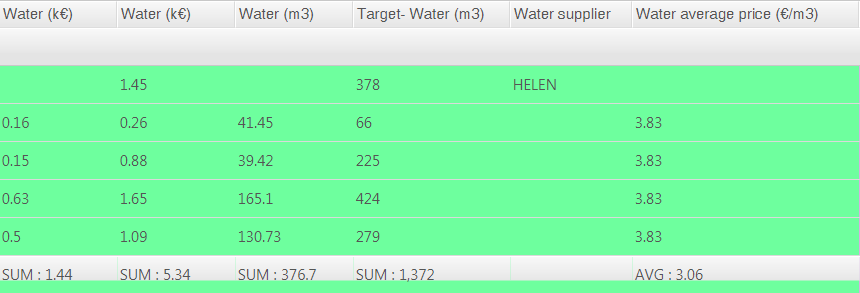
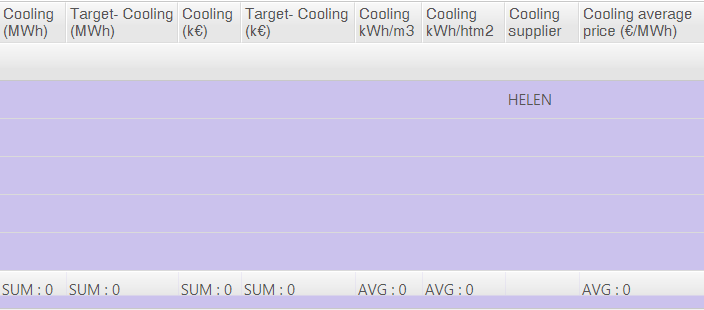
The building data are shown in a table, in which different colors are used to indicate data related to different energy types as well as the CO2 emissions. The data for both an individual building as well as the whole portfolio are shown. The data for portfolios and properties can be viewed by scrolling the scrollbar below the table.

Selecting information
Selecting properties
Select the desired portfolio and building from the drop-down menus at the top of the page.

| Note | |
|
The Select all option can be used to select all properties in the portfolio. |
Selecting the year
Select the year, the data of which you want to view, from the drop-down menu at the top of the page.

Time selection
The Time selection allows you to specify the timespan by selecting the start and end time with the accuracy of a month.

Open in dialog
With the Open in dialog button you can display the information in the table in a new tab.

Viewing the data
General information on the properties
General information on the properties is shown on a gray background. In addition, the total consumption and costs of the building as well as the corresponding targets are shown in the table.

| Note | |
|
You can get to the Energy reports page by pressing the name of a building. |
Electricity
Heat

Water
Cooling
CO2 emissions